Data Science
·Offline
Advanced Data Analytics Course: Power BI & Python
- ✓ Advanced Power Query, DAX, and Data Modeling
- ✓ Machine Learning & Predictive Analytics with Python and Power BI
- ✓ Data Storytelling & Sentiment Analysis
- ✓ Python Fundamentals and Data Manipulation
Free consultation · Certificate on completion · Practical learning
Duration
2 months
Format
Offline
Level
Intermediate
Starts
15.04.2026
Certificate
On completion
Payment
Monthly
Price
85,000 ֏
Program
-
Combine / Append Data from Multiple Workbooks
-
Combine All Files in a Folder (with Excel Tables)
-
Import All Sheets BUT Data Starts from Different Rows
-
Import from Folder - Mixed Letter Case Headers & Trailing Spaces
-
Better Collaboration - File Path as Parameter in Power Query
-
Overcome Potential Errors when Combining Sheets
-
Using Power Query Parameters
-
Assign Unique Number to Group
-
Create a Calendar Table From Start to End Date
-
Defining & Invoking Custom M Functions
-
Error Handling - Bulk Replace Lookup with Try Otherwise
-
How to Use List Functions in Custom Column
-
Advanced Pivot & Unpivot
-
Unpivot & Consolidate Data From Multiple Sheets (with Custom Function)
-
IF Then & Lookup Operators to Lookup Values in Previous Row
-
Lists & Records and how to Reference a Specific Cell in a Table
-
M Language - How M Thinks (let Expression & Values)
-
Merge Values from Rows into One Cell
-
Power Query Text Functions (Text.Contains, Text.Replace)
-
Query Folding
-
Rank by Group (Nested Rank) with Power Query
-
Running totals by Month (Invoking functions)
-
Speed up Queries - Table.Buffer & How to Test Impact (Hidden Tip)
-
Understand Each Keyword & the Purpose of _ (underscore)
-
Introduction to Python
-
Setting Up Anaconda: Your Python Environment
-
Intro to Pandas and NumPy libraries
-
Mastering Dictionaries and Dataframes in Python
-
Essential Dataframe Functions for Data Manipulation
-
Combining and Filtering Data in Python
-
Data Visualization: Unleashing the Power of Python
-
Creating Python-Enhanced Reports
-
Introduction to String Functions
-
Mastering User-Defined Functions in Python
-
Building Cleaning Functions for Data Preprocessing
-
Visualizing Cleaned Data: Unveiling Patterns and Insights
-
Building an Interactive Heatmap Dashboard in Python
-
Lists and For Loops: Harnessing the Power of Iteration
-
Exploring Three Ways to Harness Python Scripting in Power BI
-
What is a Data Model?
-
Principles of data normalization
-
Understanding data tables vs. lookup tables
-
Creating table relationships in Power BI Desktop
-
Design a data model that uses a Star schema
-
Snowflake schemas in Power BI
-
Managing & editing table relationships in Power BI Desktop
-
Managing active vs. inactive relationships
-
Understanding relationship cardinality
-
Understanding filter flow
-
Two-way filters in Power BI Desktop (USE WITH CAUTION!)
-
Hiding fields from the Power BI report view
-
Table and column properties
-
Common date table (using DAX and Power Query)
-
Hierarchies and data granularity
-
Role playing dimensions
-
Power BI data model best practices
-
Basic DAX operators
-
Intro to DAX calculated columns
-
Intro to DAX Measures
-
Implicit vs. Explicit Measures
-
Understanding Filter Context
-
Logical, statistical, mathematical and text functions
-
Iterator (X) functions
-
Information, Filter & Value and Time Intelligence functions
-
Earlier and Earliest functions
-
LASTNONBLANKVALUE function
-
RANKX function with Slicer
-
RANKX, TOPN, CROSSFILTER, TREATAS functions
-
WINDOW, INDEX and OFFSET functions
-
CALCULATE with or without FILTER
-
SELECTEDVALUE and SELECTEDMEASURE functions
-
Calculation Groups
-
DAX Query View
-
DAX INFO.VIEW Functions
-
AI Documentation with TMDL
-
Exploring the Report view in Power BI Desktop
-
Visualize Data in the Form of Various Charts, Plots, and Maps
-
Applying slicing and filtering
-
Sorting
-
Synch slicers
-
Using themes
-
Drillthroughs and drill downs
-
Bookmarks
-
Page navigation
-
Edit interactions
-
Anomaly detection
-
Decomposition trees
-
Custom Visuals
-
New Button Slicer
-
New Card Visual
-
Study relationships between a dependent variable and one or more independent variables.
-
Use cases: predicting sales, revenue, customer behavior, or other key business metrics.
-
Simple (one independent variable) vs Multiple Regression (multiple independent variables).
-
When to use regression for business insights and decision-making.
-
Overview of implementing regression using built-in visuals, DAX.
-
How to interpret regression outputs: coefficients, R², residuals, and predicted vs actual value
-
Logistic Regression – used for categorical outcomes (e.g., fraud detection, purchase/no purchase).
-
Key Metrics for Logistic Regression (Accuracy, Precision & Recall, F1 Score, Confusion Matrix, ROC Curve & AUC (Area Under Curve))
-
Introduction to Time Series
-
Smoothing Techniques
-
Trend and Seasonality Modeling: Additive and Multiplicative Models
Machine Learning & Predictive Analytics with Python
-
Introduction to Machine Learning for Analytics.
-
What ML is and why it matters for data-driven decisions.
-
Key types of ML: supervised vs unsupervised learning, with business-focused examples.
Regression Models as ML Techniques
-
Linear regression: modeling relationships between variables.
-
Polynomial regression: handling non-linear patterns.
-
How regression fits into the broader ML landscape.
Model Evaluation & Insights
-
Metrics: R², RMSE, MAE, MSE for regression performance.
-
Interpreting results for business decision-making.
Integration with Power BI
-
Import Python ML outputs into Power BI dashboards.
-
Visualize predicted vs actual values for actionable insights.
-
Demographic, geographic, behavioral, psychographic, and Recency, Frequency, Monetary (RFM) based segmentation.
-
Includes clustering methods such as K-Means for data-driven grouping.
Market Basket Analysis (Frequently Bought Together Items) with Python and Power BI
-
Understand the importance of data storytelling for decision-making and stakeholder communication.
-
Learn sentiment analysis basics: extracting positive, negative, and neutral sentiment from textual data.
-
Use Python in Power BI to calculate sentiment scores.
-
Build interactive dashboards that convey insights clearly using charts, KPIs, and narrative elements.
-
Highlight trends, sentiment changes over time, and key insights for business actions.
-
Understand the purpose of ABC-XYZ analysis in classifying products or customers based on value and demand variability.
-
Learn how combining ABC (value-based) and XYZ (stability-based) methods supports smarter inventory and sales decisions.
-
Categorize products or customers using sales volume, revenue, or frequency metrics to reveal key business drivers.
-
Identify stable, irregular, and unpredictable demand patterns to optimize forecasting, stock levels, and resource allocation.
-
Build automated ABC-XYZ classification dashboards using DAX and Power Query for segmentation and monitoring.
-
Visualize performance by category to highlight high-value, high-stability items and guide inventory or marketing actions.
-
Understand what a cohort is and how cohort analysis helps reveal behavioral patterns over time.
-
Learn why cohort-based metrics provide deeper insights than overall averages for churn and retention.
-
Analyze customer groups based on their first purchase or signup to measure long-term retention and churn rates.
-
Identify trends in customer engagement and retention using time-based cohort comparisons.
-
Build cohort and retention dashboards in Power BI using DAX, date tables, and calculated measures.
-
Visualize retention matrices and curves to uncover actionable insights for customer retention strategies.
Why Join the Course?
Why Join the “Advanced Data Analytics: Power BI & Python” Course?
This course is designed for learners who already have experience working with data and possess a solid foundation in analytics. Now is the perfect time to deepen your knowledge. Throughout the program, you will work with Python and Power BI, gaining expertise in automation and forecasting, building dashboards, conducting business predictions, and making data-driven decisions for your company or projects.Get 5% Cashback
Pay with  QR Code
- 1 Pay the tuition by bank transfer in your own name.
- 2 Receive the electronic settlement document confirming the payment.
- 3 File your annual income declaration and include the tuition expense.
- 4 Once approved, the amount is refunded to your bank account.
Who is this course for
-
✓
Data Analysts and Business Analysts
Ideal for analysts who want to advance their Python and Power BI skills and expand their technical toolkit.
-
✓
Economists, Finance Specialists, Marketers and Product Managers
Perfect for professionals looking to make better, data-driven decisions in their daily work.
-
✓
Professionals from Other Fields
Open to anyone working with data who wants to automate analytical processes and enhance their analytical capabilities.
What you will learn
- ✓Advanced Power Query, DAX, and Data Modeling
- ✓Machine Learning & Predictive Analytics with Python and Power BI
- ✓Data Storytelling & Sentiment Analysis
- ✓Python Fundamentals and Data Manipulation
- ✓Regression Analysis and Time Series
Ready to join this course?
Secure your place and take the next step in your professional growth.
Frequently asked questions
Each course is labelled beginner, intermediate or advanced. If you are unsure, book a free consultation and we will help you choose.
Flexible payment options are available for most programs. Contact us to discuss the right plan for you.
We mostly hold trainings with a Project Based Learning approach. Thanks to this approach, the students gain practical knowledge and develop their proficiency in the most efficient way.
After each training the students pass exams. Thus, both students and trainers have the opportunity to clearly assess the effectiveness of the training. Based on the results of the exams the students get certificates.
Upon completion of the training we give certificates to our students. Moreover, those whose performance is above 80% receive certificates of excellence.
We have developed a partner network that includes current best employers. In cooperation with them we do our best to assist our students in finding jobs. This network also helps us to organise internships for our students after the trainings.
Payment for the courses is made after the first lesson until the second lesson, in cash or by transfer. Payment for each stage is made for a fixed amount of 8 lessons.
Our courses are held in 2 main formats: online and offline. We believe that maintaining the format is very important for the effectiveness of the course.
BDG classrooms are technically equipped, and if necessary, we also provide students with laptops.
There is a break during each course, during which you can have a coffee and tea break.
HR consulting is carried out with our Career Development Specialist. With him, you can discuss your CVs, make corrections and finalize them, ready to apply for jobs.
All course materials, including recordings, books provided by trainers and other educational materials, are constantly available to our students during the course.
Individual courses are not currently designed, based on market needs and demands. During group courses, participants are also actively involved in teamwork, develop their communication skills, and learn to work in a team.
There is no age limit as such, as we value the spread of education to all age groups. It is especially important for us that people who already have experience and knowledge and want to acquire a new profession also go into a new educational direction.
Admission to each course is carried out through an interview or a test, or both at the same time. The choice of admission method depends on the requirements and specifics of the course.
We provide technical support to all our students related to the operational work of computers, as well as technical issues. The support is provided by our employee within the framework of the course.
Our team is in constant contact with students to provide the information you need, if necessary.
Certificates
Certificates you can receive
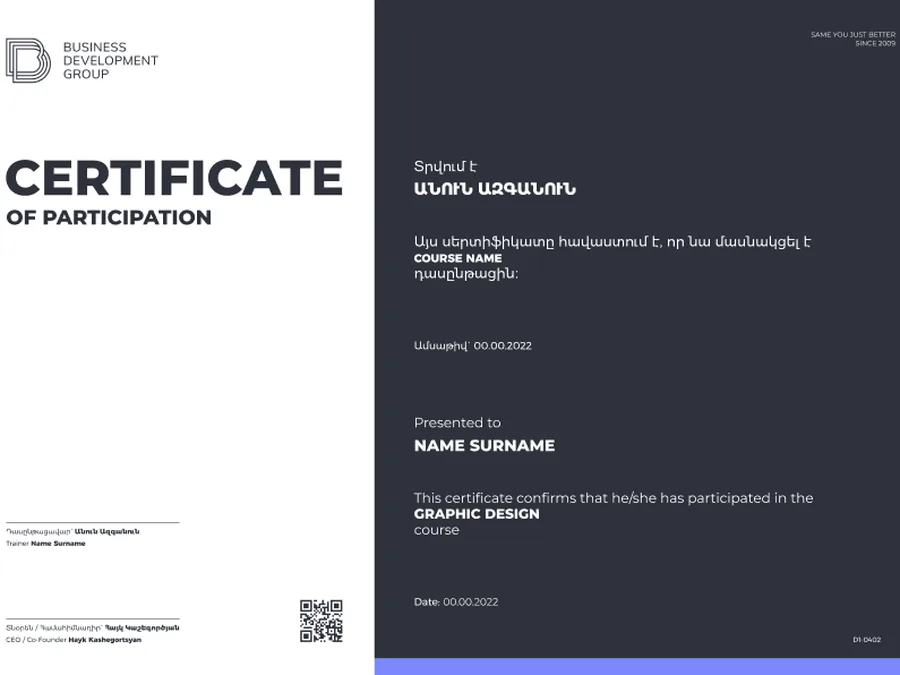
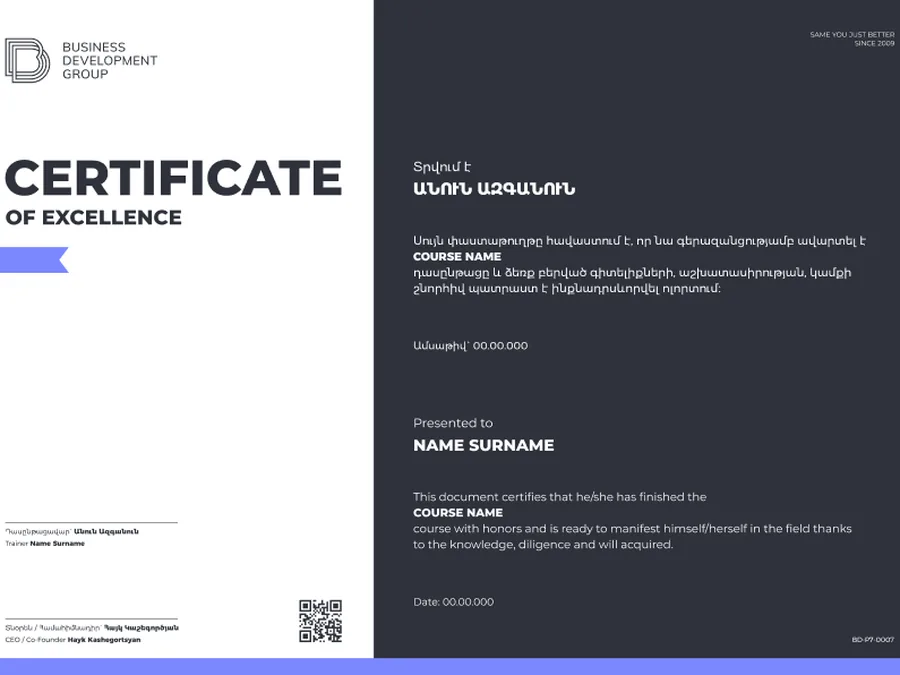
Depending on the course format and results, students can receive one of BDG's certificate types.
- ✓ Verified BDG certificate
- ✓ QR / signature-ready format
- ✓ Armenian & English certificate design
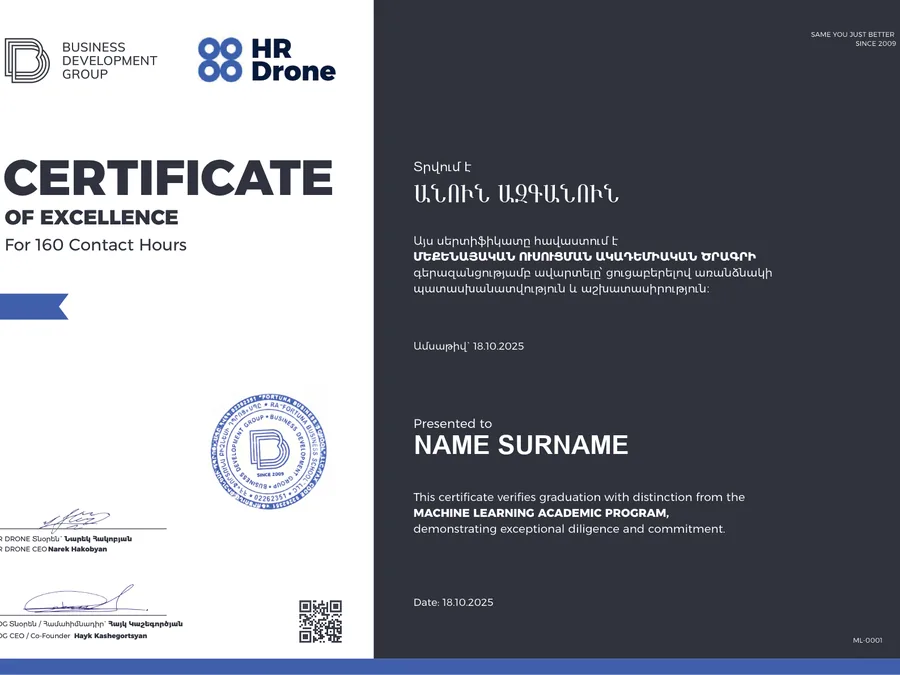 Co-branded
Participation
For students who actively participate in the course learning process.
For active participationCompletion
For students who complete the course requirements and finish the program.
For successful completionExcellence
For students who complete the course with outstanding results and strong performance.
With distinctionHR Drone
A co-branded certificate for selected HR and partner-certified programs.
Co-brandedData Science
Ready to start Advanced Data Analytics Course: Power BI & Python?
Book a free consultation and reserve your place in the next cohort.
85,000 ֏
2 months · Starts — April 15, 2026
Keep exploring
Related courses